

$1.3T 11,880 42% 10.2x
Global M&A value, Q2 2026 Deals closed or announced Value from deals >$5B Median EV/EBITDA, TTM
Global M&A activity in the second quarter of 2026 told two different stories depending on where you looked.
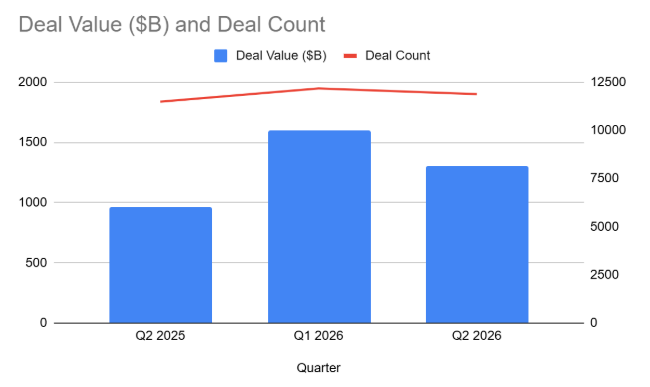
Total deal value reached an estimated $1.3 trillion, up 35.3% from the same quarter a year earlier but down 18.4% from Q1 2026's $1.6 trillion. Deal count, meanwhile, barely moved: an estimated 11,880 transactions, up 3.4% year over year and down just 2.4% quarter over quarter. That divergence is the story of the quarter. Value pooled at the very top of the market while the broader deal base stayed essentially intact, a pattern PitchBook's Q2 2026 Global M&A Report describes as a market "led by strategic acquirers" in which deals of $5 billion or more, just 34 transactions, accounted for $553 billion, or roughly 42% of total value.
"A softer market masked by megadeals" is how the quarter is best summarized: aggregate value fell sharply from Q1's record pace, but the underlying deal count held its ground, and the biggest checks got even bigger.
01 The overview: fewer whales, bigger whales
The headline number obscures a market that, beneath the surface, looked steadier than the quarter-over-quarter decline suggests. With deal count essentially flat, the drop in aggregate value reflects fewer and very large transactions clearing in Q2 than in an unusually strong Q1, not a broader retreat from dealmaking. For management teams and boards weighing a move, that distinction matters: the appetite for transactions in the middle of the market did not disappear, but the capital available for the largest platform deals has become more selective and more concentrated among strategic buyers with balance-sheet or stock currency to spend.
GLOBAL M&A VALUE AND DEAL COUNT
Source: PitchBook Q2 2026 Global M&A Report, p.4.
Strategic buyers filled the vacuum left by private equity. Buyout and LBO value fell to $287.3 billion in Q2, down 35.7% quarter over quarter and well below its cycle peak, as the Federal Reserve held rates steady with expectations rising between the March and June meetings and the European Central Bank hiked rates for the first time since 2023. That combination made the math on leveraged buyouts harder to underwrite, and sponsors leaned toward smaller add-ons instead of transformational platform bets. Strategic M&A value, by contrast, held at $892.7 billion, with corporate acquirers funding several transactions above $10 billion from balance sheets and stock rather than debt. (Source: Mergers & Acquisition, PitchBook Q2 2026 Global M&A Report, p.5).
Cross-border capital kept tilting toward North America even as the region's own deal activity cooled. On a year-to-date basis, North American targets acquired by non-North American buyers drew $276.7 billion across 645 deals, while European targets acquired by non-European buyers attracted $207.6 billion across 819 deals. The May 2026 implementation of the US-EU tariff framework, capping most US duties on EU goods at 15% while eliminating EU tariffs on US industrial goods, removed one source of transatlantic uncertainty even as it introduces new supply-chain compliance questions for acquirers.
02 Pricing discipline holds even as headline value swings
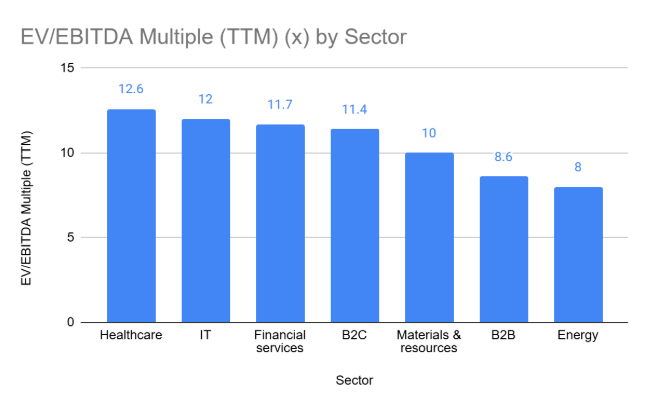
The most notable thing about Q2 valuation data may be what didn't happen. Even with aggregate deal value swinging on the back of a handful of megadeals, the median EV/EBITDA multiple held at 10.2x on a trailing-twelve-month basis, squarely within its long-run range. Sellers are not repricing downward, and buyers are transacting only where they can justify the entry multiple, a discipline that is keeping overall pricing intact even as deal mix shifts underneath it.
Where dispersion shows up is between sponsors and corporates, and across sectors. The median buyout EV/EBITDA multiple ran at 12.2x on a TTM basis against 9.3x for corporate acquirers, a gap of roughly three turns that has narrowed from 4.6 turns in 2024 as buyout multiples eased from their 2024 peak of 12.9x and corporate multiples firmed. Sector dispersion is wider still: healthcare carried the highest median multiple of any sector at 12.6x TTM, with an average of 20.4x, the richest level in twenty years, while energy sat at the other end at 8x, roughly 10% below its prior peak.
MEDIAN M&A EV/EBITDA MULTIPLE BY SECTOR (TTM)
Source: Mergers & Acquisition, PitchBook Q2 2026 Global M&A Report, p.7, 26-32.
The gap between public and private pricing also frames the take-private opportunity set. The S&P 500 traded at a trailing price-to-earnings ratio near 24.7x and a forward ratio around 20x at quarter-end, historically full levels that sit well above the 10.2x TTM median M&A EV/EBITDA multiple. Acquirers pursuing a take-private have to pay a control premium on top of already-elevated public valuations, and the EV/revenue split reinforces the point: buyouts cleared at a median 2.2x on a TTM basis versus 1.4x for corporate deals.
03 Where the deals are: a sector rotation, not a broad contraction
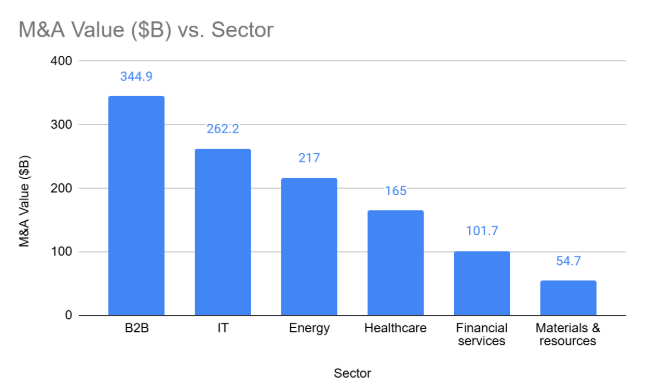
Sector-level data makes clear that Q2 was a rotation rather than a uniform pullback. B2B remained the largest slice of the market by count, at an estimated 39.4% of total deal volume, even as sector value slipped 3% quarter over quarter to $344.9 billion. Information technology value fell 38.7% quarter over quarter to $262.2 billion as sponsor-led software buyouts collapsed to $32.5 billion, down 60.5% sequentially, while strategic IT value held firm at $213.6 billion on the back of AI and software consolidation, including Cursor's $60 billion acquisition. Energy value surged 385.5% year over year to an estimated $217 billion, its second-highest quarter on record, powered by the $118.5 billion Dominion Energy and NextEra Energy merger and structural demand from AI datacenters, which are projected to push US datacenter grid-power demand to 75.8 gigawatts in 2026. Healthcare advanced on both value and count, reaching an estimated $164.99 billion, up 71.6% year over year, as an oncoming wave of patent-cliff expirations through 2030 pushes large drugmakers toward late-stage, de-risked acquisitions.
SECTOR M&A VALUE, Q2 2026 (GLOBAL)
Source: Mergers & Acquisition, PitchBook Q2 2026 Global M&A Report, p.26-32.
B2C value is omitted here because the report states only percentage moves (down 44.5% QoQ, up 9.2% YoY, against a Q1 base inflated by the $110 billion Warner Bros. Discovery deal) without disclosing an absolute quarterly figure.
Financial services was the clearest laggard, falling to a two-year low of $101.7 billion as megadeal activity thinned from 24 transactions worth $118.9 billion in Q1 to just 19 deals worth $46.4 billion in Q2. Real estate investment trusts dominated what large deals did clear, led by the $6.6 billion acquisition of First Capital REIT and the $6.2 billion merger of equals between Equity Residential and AvalonBay Communities. Materials and resources rebounded 28.5% quarter over quarter to $54.7 billion, with mining, particularly gold and coal, accounting for eight of the sector's top nine transactions amid a backdrop of volatile commodity prices.
04 A friendlier antitrust climate is doing real work
Regulatory posture shifted meaningfully in both the US and Europe during the quarter, and dealmakers are responding to it. In the United States, the FTC and DOJ resumed granting early termination of the standard Hart-Scott-Rodino waiting period for deals that raise no competitive concerns, and a federal court vacated the 2024 HSR rule that had expanded premerger filing requirements. Europe's posture is more nuanced but moving in a similar direction: the European Commission published a draft of revised merger control guidelines in April 2026 that explicitly weighs the benefits of scale, innovation, and global competitiveness, and the UK's Competition and Markets Authority appointed a former Amazon executive as its new chair in February, a signal read as more business-friendly.
What this means for dealmakers: PitchBook's research team frames clearance timing, rather than outright prohibition, as the more relevant risk for deals moving through 2026. Early engagement with regulators and well-crafted concessions are increasingly what separates deals that close from deals that stall.
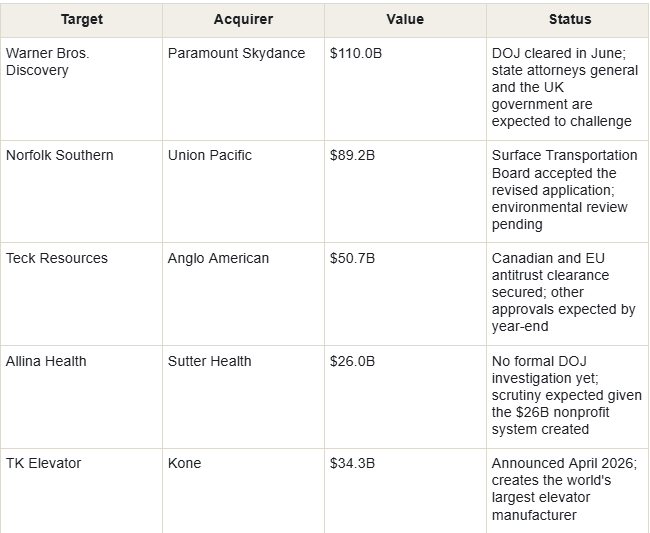
Several marquee transactions illustrate both the opportunity and the residual friction in this environment.
Source: Mergers & Acquisition, PitchBook Q2 2026 Global M&A Report, p.16-18, 26.
05 PRIVATE MARKET M&A
Aggregate figures describe the market; individual transactions show what strategic buyers are actually optimizing for. These two deals illustrate a pattern visible across this quarter's IT and B2C activity: acquirers paying for narrow, defensible technology or distribution rather than for scale alone.
01: Instacart acquires Arpalus: Strategic tuck-in / computer vision
Instacart announced on July 16, 2026 that it had acquired Arpalus, a computer vision company, to improve the shelf-level inventory accuracy of its own grocery platforms. Arpalus' technology, purpose-built for grocery retail, turns a smartphone or camera-equipped device's video scan of a store shelf into a real-time inventory picture with greater than 95% accuracy. Instacart plans to activate the technology across its existing 600,000-shopper network, which visits large-format stores more than 15 times per day on average, as well as in its camera-equipped Caper Carts, feeding shelf data into Instacart Marketplace, Storefront Pro, and Store View. The deal is the third grocery-technology acquisition Instacart has disclosed in recent quarters, following its acquisition of Colombia-based Instaleap in April 2026 and its May 2025 acquisition of Wynshop, an eCommerce solutions provider for grocers and retailers.
Acquirer: Instacart Target: Arpalus Deal type: Strategic acquisition Announced: July 16, 2026
Source: "Instacart Acquires Arpalus to Move Intelligence In Store," PYMNTS, July 16, 2026.
02: Recharge acquires Skio for $105 million: Strategic roll-up / DTC commerce infrastructure
Skio, a Y Combinator alum building subscription-commerce infrastructure for direct-to-consumer brands, sold to Recharge for $105 million in cash after raising only $8 million in outside capital, according to its founder. The company reached $10 million in annual recurring revenue and profitability within three years and had grown to $32 million in ARR and $48 million in payments processed at the time of the sale. The combined company brings Recharge's subscription-commerce platform together with Skio's technology across a customer base the companies describe as more than 20,000 brands, an example of the bolt-on consolidation that has continued in B2C and IT infrastructure even as sponsor-led software buyouts pulled back sharply elsewhere in the quarter.
Acquirer: Recharge Target: Skio Deal value: $105M cash Capital raised by target: $8M
Source:"Y Combinator alum Skio sells for $105M cash, only raised $8M, founder says," TechCrunch, April 30, 2026.
Both deals have a common theme - the acquirer already had the distribution and was buying a specific capability gap, shelf-level computer vision in Instacart's case, subscription-billing infrastructure in Recharge's, rather than buying revenue or market share outright. This is broadly consistent with the disciplined-pricing environment PitchBook describes at the aggregate level, where buyers are transacting only where they can justify the entry multiple.
06 What to watch in the second half
Three questions from the report's own analysis look likely to shape the second half of 2026. First, whether public equity multiples compress toward private-market discipline or private multiples re-rate upward will determine how the take-private pipeline develops, given the gap between the S&P 500's roughly 24.7x trailing P/E and the 10.2x TTM median M&A EV/EBITDA multiple. Second, whether the patent-cliff urgency driving healthcare's strategic activity broadens from the largest acquirers into the midmarket, where activity is already building, will determine whether healthcare's growth story extends. Third, and most structurally, whether a broader set of AI-native companies emerges from the venture ecosystem with the economics to anchor sponsor-led buyouts again, or whether equity value simply consolidates into the handful of platforms already at scale, will determine when, or if, sponsor-led software M&A returns from its current standstill.
Sources
"Q2 2026 Global M&A Report," published July 9, 2026.
"Instacart Acquires Arpalus to Move Intelligence In Store," PYMNTS, July 16, 2026.
"Y Combinator alum Skio sells for $105M cash, only raised $8M, founder says," TechCrunch, April 30, 2026.
Figures for Q1 2026 and Q2 2025 deal counts in the overview chart are calculated from percentage changes explicitly stated in the PitchBook report against its Q2 2026 base figure; all other data points are stated directly in the source document. This article reflects publicly available,TFP-archived research and TFP conducted research and opinion as of July 20, 2026 and is not investment, legal, or accounting advice.
